How MeridiArc finds market cycles
By Urmas Rehkalt, founder. Last updated 27 September 2026
What MeridiArc does to a price history, how it decides which cycles deserve your attention, and where it stops. The principles, in plain words.
What is a market cycle?
A market cycle is a rhythm in price: a rise and a fall that recurs at a roughly regular length, measured in bars. Most price histories carry several at once, of different lengths, on top of a longer trend. Cycle analysis separates them so that each one can be looked at, and judged, on its own.
Any series of prices can be described as a sum of waves. That is why cycles can be found at all, and also why finding one proves nothing by itself. The useful question is not whether a wave fits, but whether it has repeated, and whether it is still there. The rest of this page is about how MeridiArc answers those two.
How does MeridiArc find cycles?
MeridiArc uses spectral analysis, also called frequency analysis. It sets the long-run trend of an instrument's price history aside and measures which cycle lengths carry the most of what is left; the strongest are the dominant cycles. Each one's length and timing are then fitted against the price itself.
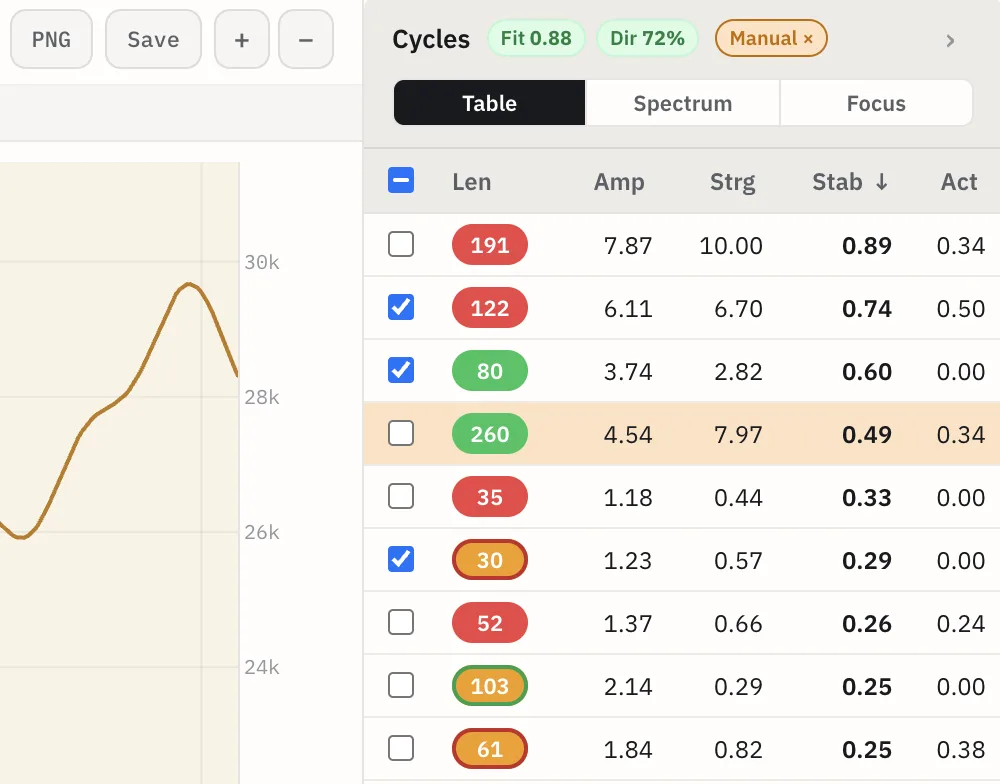
Nothing is chosen for you in advance. The lengths come from the instrument's own history, not from a fixed list, so they can differ from one instrument to the next and change as the history grows. Every cycle found carries five measures:
- Length: the number of bars from one peak to the next.
- Amplitude: how large the swing is.
- Strength: how much the cycle stands out in the spectrum, relative to the strongest one found.
- Stability: whether the cycle has actually repeated.
- Activity: whether it is still driving price now.
You choose which cycles to keep, and MeridiArc adds the kept ones together into one line that runs through the history and continues past the last bar.
How is a cycle judged stable?
Stability asks one question: has this cycle actually repeated? The history is divided into stretches one cycle long, and the score measures whether the cycle's peaks keep landing in the same place in each of them. A cycle that looks strong but only showed up once scores low.
This matters because spectral analysis will find cycles in any data, random noise included. Repetition is the first thing that separates a real rhythm from an artefact of the measurement, which is why the cycle table opens sorted by stability. A cycle needs several repetitions in the loaded history to be tested at all; with too few, it scores zero rather than getting the benefit of the doubt.
Stability looks back over the whole record. Activity looks only at the last few cycles, and says whether the cycle still matches price now. The two are kept apart on purpose: a cycle that used to work and has since faded scores high on the first and low on the second, so it cannot pass for a live one.
What does the next turn tell you?
The next turn is the date where the line built from the cycles you keep changes direction, and whether it turns up or down. It is one computed date, not a range, so treat it as a point to watch rather than a date to trade. How far to trust it depends on the cycles behind it.
That is why it never stands alone. Next to it sit the stability and activity of every cycle that went into it, and two readings of the line itself: the fit, which shows how closely it has followed recent price, and the direction agreement, which shows how often it has moved the same way as price did.
How can you check a projection?
Two ways, and both are built in. You can set the chart to any past date, and MeridiArc refits using only the bars up to that day, so you see the projection it would have drawn then and can compare it with what the market did next. And you can save a chart, which keeps the fitted cycles exactly as they were.
The second one is easy to underrate. A fresh fit on newer data would draw a different line, one that quietly agrees with whatever has happened since. A saved chart does not move, so the projection you judge months later is the one you actually made.
How is this different from Hurst cycles?
Hurst's cycle theory starts from a fixed nominal model: a family of cycle lengths, each roughly double the one below it, assumed to be present in every market, which the analyst then locates on the chart. MeridiArc starts from the other end. It measures which lengths an instrument's own history contains, and scores each one for repetition.
So the lengths are an output, not an input, and they can differ between instruments and over time. Cycle scanners built on the Goertzel algorithm belong to the same measured family as MeridiArc: they test a range of lengths against the data. The difference is emphasis rather than kind. MeridiArc puts the whole cycle table in front of you, sorted by repetition, with a separate reading of whether each cycle is active now, and keeps every projection checkable after the fact.
What can it not do?
It cannot tell you the future. A cycle measured in the history describes the past; a high stability score says it repeated, not that it will. The limits below are the ones worth knowing before you rely on a projection.
- A cycle has to repeat several times in the loaded history to be tested, so the longest cycles can only be found on long histories.
- Spectral analysis finds cycles in any data, noise included. Stability is a guard against that, not a guarantee.
- Stability looks at the whole record. Read it together with activity, or a cycle that has faded will look better than it is.
- The next turn is one date with no error range around it.
- The most recent part of any cycle fit is the least settled: the last bars have not yet had the rest of their cycle happen.
- Prices come from third-party data providers. Occasional gaps are filled rather than left empty.
- None of it is investment advice. The decisions, and the risk, are yours.